
New Study Shows that Lying About Your Hamburger Intake Prevents Disease and Death When You Eat a Low-Carb Diet High in Carbohydrates
New Study Shows that Lying About Your Hamburger Intake Prevents Disease and Death When You Eat a Low-Carb Diet High in Carbohydrates

A few readers alerted me to a new study claiming that a plant-based, low-carb “Eco-Atkins” diet is associated with a lower risk of mortality and disease, while an animal-based low-carb diet is associated with an increased risk of mortality and disease, as well as an editorial by Dean Ornish in the Huffington Post lauding the study for supporting his emphatic declaration that an optimal diet is one high in fruits, vegetables, whole grains, legumes, soy products, fat-free dairy, and egg whites. Dr. Ornish titled the article “Atkins Diet Increases All-Cause Mortality” as if the study had shown cause-and-effect (or had anything to do with the Atkins diet), when of course it only would have shown this in an alternate universe where the laws of logic are reversed, or perhaps on Opposite Day.
Denise Minger has already produced a great critique of the specific findings of the study. I highly recommend hopping over to her blog and reading it if you haven't already. In this post, I'd like to make a few comments about its approach, and the abuse and misuse to which its findings have been subjected. In brief, these comments will address the following themes:
Anyone who draws the conclusion from this study that a low-carb, animal-based diet promotes disease while a low-carb, plant-based diet prevents disease should be teaching a graduate class called “How to Abuse Logic, Misuse Statistics, and Invert the Scientific Method.”
This study used a bizarre classification of “low-carbohydrate,” only one-third of which was determined by carbohydrate intake.
Epidemiological studies about meat intake usually tell us less about the risk or benefit of eating meat and more about people's propensity to lie about how much hamburger they eat.
Going Backwards
This study is an epidemiological, observational study. It looks at what people are eating of their own choosing, follows them for a few decades, and looks at how many people contract a given disease or die. According to the scientific method, this qualifies as an observation.
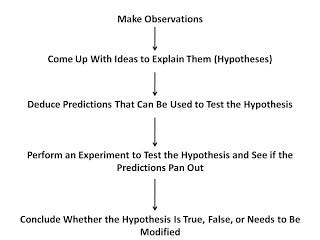
The scientific method goes like this: we make observations, we come up with ideas to explain them called hypotheses, we perform experiments to test predictions generated from those hypotheses, we make conclusions based on the experiments about whether our ideas are correct, and then if other people can replicate those experiments, more and more poeple will begin to accept our conclusions.
Let's depict it graphically. If we pretend this is a map and pay close attention to the arrows, we can see why the appoach of this study is a bit like trying to travel from California to Virginia by going west. You're going to get pretty wet.
These authors decided to test their hypothesis by making more observations:
Because the leading causes of death in the United States — cardiovascular disease (CVD) and cancer — develop over many years, long-term studies of low-carbohydrate diets are needed to evaluate effects on mortality. However, randomized trials of low-carbohydrate diets on mortality are not feasible because of the difficulty in maintaining adherence and follow-up over many years. . . . Therefore, we prospectively examined the relationship between different types of low-carbohydrate diets and all-cause and cause-specific mortality in 2 large cohorts in the United States.
Splash! I hope they enjoy swimming in the Pacific, but the arrows simply don't flow backwards from hypothesis to observation, and amassing more and more observations to “test” your hypothesis leaves you with nothing but the same hypothesis and a huge stack of paper.
The syllabus for “How to Abuse Logic, Misuse Statistics, and Invert the Scientific Method” might look something like this:
9/3/10 — How to Escape the Restraints of the Scientific Method
9/10/10 — The Brazilian Paradox: Scientists Struggle to Explain How the Correlation Between Shoe Size and Reading Ability During Childhood Persists in Brazil Despite the Complete Absence From the Market of Brazilian Children's Books About How to Increase the Size of Your Feet
9/17/10 — Mama's Muffins Always Tasted Good, Proof That Mama Must be Making Mario's Pizza, Verified to Taste Good in the Italian Prevention With Pepperoni Cohort, Consisting of Over 45,000 Person-Years and 76,000,000 Consumed Pepperonis
9/24/10 — The Application of a New Statistical Method to Prove that Animal Protein Causes Cancer by Estimating Total Meat Intake From the Consumption of Hamburger Buns
9/31/10 — The Scientific Method as an Anachronism: An Historical Overview
10/6/10 — Application of a New Statistical Method to Prove the U.S. Constitution is an Anachronism by Measuring the Growth of Bureaucracy Over Time
And so on. What a class! Sign me up. Expert panels, here I come.
A Fuzzy Definition
The authors had a pretty funny way of determining what constitutes “low-carbohydrate.” They made a score of thirty points. Ten of the points came from eating low-carbohydrate. Ten came from eating high-fat, and ten came from eating high-protein. They didn't give detailed information on the protein and carbohydrate intakes of all the groups, so it's easier to look at the paper in which they originally defined this score (a separate study).
In table one, we see that those with the highest protein intakes consumed more than 26 percent of their calories as protein, those with the highest fat intake consumed more than 47 percent of their calories as fat, and those with the lowest carbohydrate intake consumed less than 29 percent of their calories as carbs.
This means that if you consumed 10 or 20 percent of your calories as carbs, it wouldn't bump your low-carb score up any more than someone who ate 25 percent of their calories as carbs. If you ate 50 percent of your calories as fat and 15 percent of your calories as protein, you couldn't gain any points from eating 10 more percent of your calories as fat, but you could gain a whopping NINE POINTS out of a thirty point score by eating 10 more percent of your calories as protein.
What???
No wonder, as Denise Minger already pointed out, these “low-carb” diets were so high in carbs.
Proof That Lying About Your Hamburger Intake Prevents Heart Disease
People obviously do not make dietary choices in a vacuum. They make them within a complex network of lifestyle, belief, culture, and perception. As a result, no matter how much adjustment is done to correlations, the correlations are never fully adjusted. To believe that “the correlations have been adjusted” is to believe that at any given point in history, all or most of the potential knowledge existing in the universe is known. Pretty arrogant, and pretty silly.
Epidemiological studies would be really interesting in populations that had no cultural beliefs about what constitutes a healthy diet, if ever those populations could be found. Otherwise, the people who most adhere to the prevailing cultural beliefs about what constitutes “healthy” are, on average, the ones who are most motivated, have the most sense of self-responsibility, and are most likely to be health-conscious. That these people have a lower-than-average risk of disease is the most uninteresting and unsurprising discovery one could possibly make.
For example, this study was based on nurses and doctors. About two-thirds of the population were from the Nurses' Health Study, and about one-third were from the Health Professional's Follow-up Study. They are employees of the medical establishment. The fact that they really believe what the medical establishment teaches can be seen by the fact that all the groups listed in the paper had PUFA intakes between fifty percent higher and almost double the national average of 6-7% of calories, something the American Heart Association recommends, albeit something that randomized controlled trials have shown is harmful and fatal. It is in any case a clear seal of belief in the mainstream position.
They were all eating more than “5 a day” of fruits and vegetables too, something likewise recommended but which is probably actually health-promoting. Again, however, it is not practiced on the SAD. These are the True Believers.
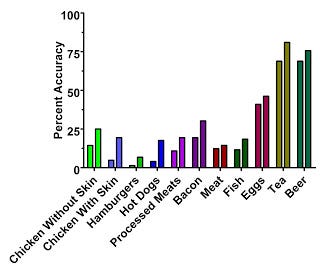
How accurate are the estimates of animal product consumption in these studies? Check out the below graph, which I adapted from the validation of the Nurses' Health Study 1980 questionnaire:
The Nurses' Health Study evaluated the accuracy of its food frequency questionnaire (FFQ) in a smaller subset of the nurses who participated. They had them fill out one FFQ at the beginning of the year. Then, four times through the year, once during each season, they had them spend a whole week meticulously weighing out and recording everything they ate. Then they filled out the FFQ a second time.
The dietary record is supposed to represent the “true” intake of food. The validation was remarkably rigorous because the investigators accounted for seasonality and extended the record over 28 days instead of three days, as was done in the China Study. Other studies have “validated” their FFQ with a 24-hour recall. The assumptions are not perfect, but the method of validation used for the Nurses' Health Study is about the best we can do short of placing a secret video camera in everyone's kitchen. (I probably shouldn't have said that. I don't want to give any of the government bureaucrats who read my blog any ideas!)
In order to determine how accurate an FFQ is, researchers calculate a value called “r-squared” between the dietary record and the FFQ. This represents the degree to which the true intake of a food accounts for the intake predicted by the FFQ. In other words, it's a rough measure of the FFQ's accuracy.
I pointed out once before in my post on red meat and mortality that the accuracy of the FFQ to predict the intake of animal foods is pretty abysmal.
In the chart, each food has two bars. The one on the left represents the accuracy of the FFQ at the beginning of the year and the one on the right represents the accuracy of the FFQ from the end of the year.
The FFQ's ability to accurately predict egg intake is the best of all the animal foods, coming in at almost 50%. The other animal foods don't look so hot. I included tea and beer, ranking in at 75-80%, just to prove the point that an FFQ isn't inherently pathetic. But look at the accuracy for hamburgers — only 1.4%! Even after meticulously weighing out and recording their foods for 28 days, the participants still only reported their hamburger intake on the FFQ with 6.8% accuracy.
Perhaps the people just didn't remember how much hamburger they ate, or perhaps the 28 days they spent recording their diet were not representative of the other 337 days of the year. But the authors of the validation study noted a trend that suggests something else is going on:
Focusing on the second questionnaire, we found that butter, whole milk, eggs, processed meat, and cold breakfast cereal were underestimated by 10 to 30% on the questionnaire. In contrast, a number of fruits and vegetables, yoghurt and fish were overestimated by at least 50%. These findings for specific foods suggest that participants over-reported consumption of foods often considered desirable or healthy, such as fruit and vegetables, and underestimated foods considered less desirable. . . . This general tendency to over-report socially desirable foods, whether conscious or unconscious, will probably be difficult to eliminate by an alteration of questionnaire design.
In other words, a study showing a statistical relationship between hamburger consumption and some health-related variable is telling us less about hamburger consumption and more about health professionals' overwhelming propensity to lie about how much hamburger they eat.
Back to the Scientific Method
The end result is that this study constitutes an observation, and cannot be used to support a hypothesis of any kind. Hypotheses are ideas developed to try to explain observations. You cannot test a hypothesis by making more observations. It is not impossible to test a hypothesis about diet over the long-term, and indeed trials have done this in the past, usually quietly swept under the rug because the establishment didn't like their results. Compliance with low-carb diets will never be perfect, but it will probably be better than the 1.4% accuracy with which food frequency questionnaires predict hamburger intake. Logical fallacies cannot substitute for the scientific method just because the scientific method seems difficult or even infeasible.
Nevertheless, logical fallacies will not be disappearing from the scene any time soon. So there's lots of work in the blogger world ahead.