
New Fatty Liver Study Shows that Carbohydrate Restriction Causes Statistical Anomalies
New Fatty Liver Study Shows that Carbohydrate Restriction Causes Statistical Anomalies

A new study claims to show that carbohydrate restriction is superior to calorie restriction at improving fatty liver disease:
In this study the authors randomly assigned 18 people to spend two weeks consuming either a low-calorie diet (~1325 kcal/day) or a low-carb, (<20 g/day), high-protein (33% kcal) diet. The low-carb, high-protein diet led to a greater reduction in the amount of fat stored in the liver.
The authors begin their manuscript by stating as a matter of fact that insulin resistance causes fatty liver, without even acknowledging the competing hypothesis that fatty liver causes insulin resistance.
After the holidays, I'll provide a more comprehensive post addressing whether it makes any sense to single out “carbohydrates” as causing fatty liver (hint: it doesn't), but for now let's take a brief look at this study.
As with any carbohydrate restriction study, there are several competing hypotheses that would be able to explain the results:
Restriction of total carbohydrate.
Restriction of wheat.
Restriction of fructose.
Restriction of refined carbohydrates.
An altered micronutrient profile.
As can be seen in the figures from my post on meeting the choline requirement, choline is found most abundantly in liver and egg yolks, and with the exception of wheat germ all the foods richest in choline are animal products. All of the plant foods with half-decent amounts of choline are pretty low in carbohydrate.
Most researchers probably do not think choline plays a major role in fatty liver disease because the most commonly used choline-deficient animal model is one of extreme restriction of choline and methionine, a restriction so extreme that it leads to wasting away instead of obesity. As I've detailed in my choline posts, however, choline protects against fatty liver in all dietary animal models regardless of whether such an extreme deficiency is present.
Thus, if this study had provided any convincing results, we would have to ask whether these results would have been so impressive if members of the low-calorie group had been given a little liver or egg yolk to boost their choline status.
But just how convincing are these results?
Before randomizing these folks to one or the other group, the authors had already measured hepatic triglyceride (liver fat), and over three quarters of the subjects had biopsies taken as part of their initial diagnosis.
When the authors randomized the subjects, they took into account age, sex, weight, and body mass, but unfortunately didn't consider it a major priority to make sure there was an equal degree of fatty liver between the subjects.
Here is the nonalcoholic fatty liver disease (NAFLD) biopsy score in the two groups at the beginning of the study:
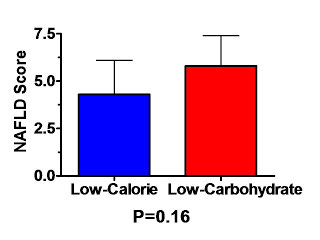
With a p value of 0.16, I suppose we could say that there is “no difference” between the groups, but 16% confidence that there is no difference translates, for me, to 84% worry that there is a difference. Of course, strictly speaking, there can't possibly be a “true” difference resulting from randomly distributing people to one or another group, so this is really 84% worry that randomization wasn't successful.
(Yes I realize I'm using some liberality in language; statisticians do not quantify “worry.”)
And what might I worry about? Yep, you guessed it: regression to the mean.
The authors, of course, were not looking at the change in biopsy score because biopsies are invasive and they were only taken once. They were looking at the change in liver fat (hepatic triglyceride).
Lucky for the authors, the relative difference in liver fat at the beginning of the study was only half the relative difference in biopsy score. Thus the liver fat was similar enough that the authors could state that there was “a similar degree of elevation in both treatment groups.”
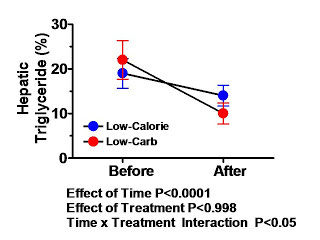
Nevertheless, let's take a look at the change in liver fat:
If we look back at my regression to the mean post, this looks a lot like the third of the three graphs marked “Change in Cholesterol Over Six Weeks,” which I described as “ambiguous.”
In the example I gave, I stated the following:
If the difference at the end of the trial is statistically significant, that would suggest the drug was indeed effective, but the fact that random chance produced a similar difference at the beginning of the trial would certainly cast doubt on just how effective the drug really is.
As in that case, the difference between the two groups at the end of the trial (four percentage points) is pretty similar to the difference at the beginning of the trial (three percentage points).
In this case, however, the difference at the end of the trial is not significant. The P value for differences between groups is 0.998 which means that if there is no effect whatsoever, we would observe similar differences over 99% of the time.
Now, we could make this look much more impressive if we adjust for the difference at the beginning and present a “change from baseline graph,” but if we are to take Newell and Simpson seriously that “the post-treatment difference in means gives the real benefit of new treatment, unbiased by regression to the mean,” then we would have to conclude that there is no real benefit of carbohydrate restriction over calorie restriction. Or, if there is, this study was not large enough or long enough to show it.
Does this study show that both treatments are effective? Not really. If patients are diagnosed mainly based on elevated liver fat concentrations, then we would expect any “treatment,” regardless of how ineffective it is, to “reduce” liver fat because of regression to the mean. With an untreated control group, or a control group randomized to a dietary treatment we know to be completely ineffective, we would be able to show the true effect of a real treatment.
I'd love to say that this study shows that consuming more choline-rich animal products decreases liver fat, but in all honesty I don't see how it shows much of anything. It deserves to be published though. Maybe some day the raw data can be included in a meta-analysis and we can derive some meaning from it.