I spent a large portion of the day today trying to figure out why a couple papers I have showed that EGCG, a component of green tea, increases glucose uptake into isolated skeletal muscle cells, but another shows the opposite.
The methods of these papers were a little different, and it's possible to speculate that some of the differences — for example, the amount of glucose in the culture dish — may have been responsible.
But it also occurred to me that perhaps EGCG doesn't have any effect on this phenomenon at all. For all I know, perhaps a hundred times so far different groups have tested the effect of EGCG on uptake of glucose into skeletal muscle cells and 100 times it had no effect, and the research seemed like a waste of time and went down the memory hole. But then a couple flukes occurred, and they were exciting, and the researchers wrote up the reports and got them published.
Melissa McEwen recently shared a New Yorker article with me, “The Truth Wears Off.” It discusses the “delcine” effect — a scientist stumbles upon an exciting phenomenon, publishes about it, but then over time as others attempt to replicate it, or even as that very scientist tries to replicate it, the phenomenon seems to wear off, becoming much less true than it originally seemed.
Part of the decline effect is likely due to publication bias. Negative findings just aren't very interesting and don't get published. Later on, when everyone believes something to be true, it suddenly becomes interesting to publish contrary research.
The New Yorker article mentions John Ioannidis, a crusader against junk science who wrote a 2005 paper that had floated around the Native Nutrition list back in the day, entitled “Why Most Published Research Findings Are False.” Ioannidis is a fascinating character, and you can read more about him in the Atlantic article, “Lies, Damned Lies, and Medical Science.”
Statistics is an important weapon in Ioannidis's myth-busting arsenal, and I think the proliferation of statistics within experiments has had a positive effect on science.
On the other hand, I think the proliferation of epidemiology, which uses even more advanced statistics, has in some ways had a negative impact because scientists and media people are too tempted to inflate the importance of these types of studies by abandoning everything taught in Stats 101 and Epi 101 like “correlation does not imply causation.”
Nevertheless, despite the rampant peddling of hypothesis-as-fact, statisticians are increasingly developing methods to detect publication and reporting bias. These will be critical to cutting through all the junk to find the truth.
Back to EGCG for a minute.
It's important to realize that every experiment has some sampling error. Statistical tests designed to determine whether a difference is likely to be real (“statistically significant”) or just a random fluke are based on the concept of a sampling distribution. The sampling distribution is based on the idea that if you repeated an experiment a hundred times, you'd get a hundred different results, but the results should all hover around the “true” value.
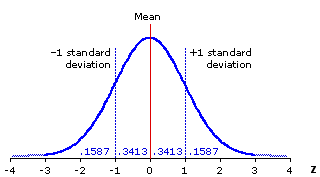
For example, let's say that the “true” effect of EGCG on uptake of glucose into skeletal muscle is zero, zip, zilch, nada. It just doesn't do anything. In that case, the “true” difference in glucose uptake between skeletal muscle cells that have been treated with EGCG and those that haven't should be zero. Thus, we can construct a theoretical sampling distribution that has a mean, or average, of zero:
The sampling distribution will be a bell-shaped curve that has as its center the “true” value, and we are offering the hypothesis that this value is zero because we are testing the hypothesis that EGCG has no effect.
The bell-shaped curve represents all the possible results of experiments. As the blue line rises, experiments are more likely to come up with that result. The curve is shaped like a bell, that is, raised in the middle, because results closer to the “true” effect — which we are hypothesizing is no effect, or zero — will be more common than results further away from the true effect.
Just how wide the curve is will depend on the statistical precision of the experiments. The greater the sample size and the lower the variability, the narrower the curve will be, meaning each experiment is likely to give a result closer to the “true” result. It will generally stretch three standard deviations in either direction. The standard deviations are marked off in units along the horizontal axis. The standard deviation of this distribution is usually called the standard error.
For the sake of simplicity, let's say that if we repeat the experiment 100 times, 95 times we'll get a result within two standard errors.
Now let's say EGCG really affects uptake of glucose into muscle. If it falls outside of that range, in the tails of the distribution, we say the result is statistically significant because the chance of getting that result if EGCG truly has no effect is less than 5%.
But, what if negative results never get published? Say there are five papers published on the topic. What if 100 people tried the experiment and 95 of them got no result so never published their findings? EGCG could have no effect, but what you might see is three papers showing a positive effect and two showing a negative effect, and 95 experiments lost down the memory hole, never making it further than some lab technician's notebook paper.
Thankfully, there are some incentives against this phenomenon. Among them, researchers don't want to waste time and money failing to generate publications. There are a great many papers suggesting that green tea can help prevent diabetes, obesity, and fatty liver disease. As a result, many labs will dedicate themselves to studying this effect and trying to explain it. This will allow them to mention negative findings to “rule out” mechanisms as part of larger papers with positive findings that render the paper “interesting” to a journal editor.
Nevertheless, publication bias is likely to be a serious problem, especially in clinical trials where there is a strong incentive to show that a drug or other treatment has an effect.
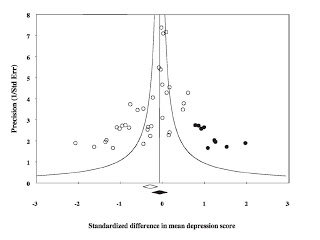
Statisticians have developed a cool tool called the funnel plot in order to detect publication bias. Here's a recent example of a funnel plot showing clinical trials of long-chain omega-3 fatty acids EPA and DHA in the treatment of depression:
Martins JG. EPA but Not DHA Appears To Be Responsible for the Efficacy of Omega-3 Long Chain Polyunsaturated Fatty Acid Supplementation in Depression: Evidence from a Meta-Analysis of Randomized Controlled Trials. J Am Coll Nutr. 2009;28(5):525-42.
In the above diagram, all the white circles represent trials that were actually published. As you move up along the vertical axis, the statistical precision increases. The plot should be funnel shaped and appear symmetrical, so that studies with more statistical precision hover more tightly around the average and studies with less statistical precision gradually spread out toward a base at the bottom.
However, as you can see above, the distribution of white circles is not symmetrical. This indicates publication bias. In order to construct the funnel plot, the authors trim off the asymmetrical portion and then draw a line down the middle of the symmetrical portion. This is the estimated “true” mean of the trials. Then, the authors estimate how many trials weren't published by throwing onto the diagram enough black circles to make the plot a symmetrical funnel shape. These black circles represent hypothetical “unpublished trials.”
Here, the authors estimated that there were nine trials that found EPA or DHA actually increased depression scores but were never published.
Obviously, there is something inherently impossible to validate about this method. We can never know what is being kept in secret, so we can never actually prove this method works.
Nevertheless, there are many methods we use in the looser sciences that we cannot validate. For example, food frequency questionnaires (FFQs) can be kind-of-sort-of validated with weighted dietary records, but people may eat differently when they are weighing their food, and weighted dietary records can never be done over the full course of time that an FFQ is meant to apply to, often a year. It is even more difficult, in fact completely impossible, to validate radiometric dating over the time course we use it for. But we use reasonable assumptions to make estimations with these tools because that is better than throwing our hands up in the air and giving up.
So while funnel plots can never prove publication bias, I hope that they will bring the probability of publication bias to light, and thereby encourage the scientific community to be more transparent.
One of the moves towards transparency currently happening is to create a database of clinical trials where they are registered before they are conducted. This is an incredibly important development that will help prevent publication bias.
Another important bias is reporting bias. If the researcher measures 100 things and reports five of them, then how much credibility can we give to the “statistical significance” of those five things? If you measure 100 things, you are bound to get five or so that are “statistically significant” but are really random flukes.
Statisticians are currently working on methods to detect this type of bias in reporting. I have no idea how they'll work, but I can't wait to find out.
The New Yorker article I linked to above is a good reminder that the marks of a true scientist are not just a willingness to think rationally and question authority, but also patience, open-mindedness, and enough humility to say “I don't know” sometimes.


I have interpret washed-up a Essay State is going to write my term paper besides discovered it to have painted the subject well as well as sharing the emend manuscript technique everywhere the paper. I would suggest that persons share uk benefits. In selecting the utility I would abet suggest the crucial info on your blog.
Hi anonymous and anonymous, thank you for the props,I'm glad you enjoyed the post. Anonymous, you are right that I could have covered Bonferonni corrections, but it wasn't very germane to this post as that is a matter of data dredging rather than publication bias. Thank you for the suggestion.
Chris
While talking about reporting bias you could have mentioned corrections for multiple testing e.g Bonferroni correction.
Thanks for the review. Helped me to understand funnel plots. Much better than my lecturer.
Chris,
This is a very informative post. I hope you will continue to share your knowledge and provide insights and education on the scientific method and statistics. I like the fact that you are always asking questions.
STG
Serdna, I agree I took some liberality with the grammar there, but I think the way I wrote it carries my meaning better. Likely or unlikely doesn't capture what I meant at all, but "more difficult, in fact completely impossible" would capture it better. I was playing on the fact that it is impossible to *truly* validate an FFQ, but we nevertheless can "kind of sort of" validate it, whereas for radiometric dating, the impossibility is more complete because we can't even "kind of sort of" validate it on the timescale for which we're using it. However, I'll probably change it to "difficult" since the reasoning behind my choice of words is pretty shaky here. Thanks. 🙂
Jako, good points. Unfortunately, it's also possible that non-industry researchers are just as biased in the opposite direction. So it's important to carefully analyze where the biases in methodology and interpretation might lie, and ultimately to have something to fall back on in the face of uncertainty like "paleo" or "traditional diets," plus personal and clinical experience. I rarely use olive oil, but I do put seasoned olives from Mt Athos in my salads. I use macadamia nut oil for the dressing. There is no such thing as "rich in ORAC." Nothing is "rich in ORAC." ORAC is an assay, a laboratory test. When used to measure the ORAC value of foods, it is rather well recognized by scientists that this is a marketing ploy and not science, as the ORAC value of foods has no direct physiological relevance.
Chris
This is all very interesting.
You may be aware of this study, also:
https://www.research.psu.edu/training/sari/teaching-support/conflict-of-interest/documents/Bias-in-Nutrition-Studies.pdf
"The main finding of this study is that scientific articles about commonly consumed beverages funded entirely by industry were approximately four to eight times more likely to be favorable to the financial interests of the sponsors than articles without industry-related funding. Of particular interest, none of the interventional studies with all industry support had an unfavorable conclusion. Our study also documented industry sponsorship was very common during the study period, indicating considerable potential for
introduction of bias into the biomedical literature. In view of the high consumption rates of these beverages, especially among children, the public health implications of this bias could be substantial."
It does make me think about the olive oil industry; all the so called "beneficial effects" of olive oil on all sorts of conditions, which has help brainwash the population into the belief that olive oil is extremely healthy and the main reason for the longevity of Greek people.
Yet, I found, for example that the phenol content in just 1-2 olives is as high as a whole bottle of olive oil, hence Greek people would probably obtain 50 times more phenols from olives than olive oil. But no-one talks about that.
A similar tendency can be observed in regards the latest new "magic berry" (e.g. Acai Berries) rich in ORAC. However, if one really want ORAC foods, one can just eat some herbs like dried oregano (or turmeric). Just a teaspoon of dried ground powder of oregano provides 5000 ORAC, five times more than a serving of Acai Berries (that cost $20/month), and 25 times more ORAC than in one capsule of krill oil. Greek people eat a lot of oregano too, of course. Oregano was found to be highly anti-microbial, in fact strongest when a variety of different herbs was compared. But no-one talks about that.
Or take krill oil; there´s little benefit of krill oil compared to for example caviar; the latter would also be clean, fresh, high in choline/phospholipids and so on, but for fraction of the price one could get equally much n3 and choline.
What it boils down to is that whenever we buy a product, be it krill oil, green tea, olive oil, ORAC supplements and so forth, we would have to pay for the marketing/propaganda and all the studies that gave no results.
I know, I am a little picky. Since I haven't found your e-mail address, I post it as a comment. Please, feel free to erase it after reading.
"It is even more impossible, in fact completely impossible" -> "It is even more unlikely, in fact impossible"
The particular researcher that spurred the article has said he, himself, can not even reproduce his own experimental results – let alone find others consistantly replicate his original findings. Apparently that researcher has no explanation, of what he says is common in experimental science, and can't find a colleague who has an explanation of the phenomena.
We think we know how evidence based science is done correctly. Yet experts in the same field still can disagree. At least my broken
clock and quantum theory are right 2 times a day.